Getting started with marimekko
getting-started.RmdWhat is a marimekko plot?
A marimekko (or mosaic) plot is a two-dimensional visualization of a contingency table. Each column represents a category of one variable, and the segments within each column represent categories of a second variable: - Column widths are proportional to the marginal counts of the x variable. - Segment heights within each column are proportional to the conditional counts of the fill variable given x.
The marimekko package provides this as a native ggplot2
layer, so you can combine it with any other ggplot2 functionality
(facets, themes, annotations, etc.).
Installation
# From CRAN
install.packages("marimekko")

# From GitHub (when published)
devtools::install_github("gogonzo/marimekko")
Your first marimekko plot
The built-in Titanic dataset records survival counts by
class, sex, and age. Let’s visualize survival by passenger class.
library(ggplot2)
library(marimekko)

titanic <- as.data.frame(Titanic)

ggplot(titanic) +
  geom_marimekko(aes(fill = Survived, weight = Freq), formula = ~ Class | Survived) +
  labs(title = "Titanic survival by class")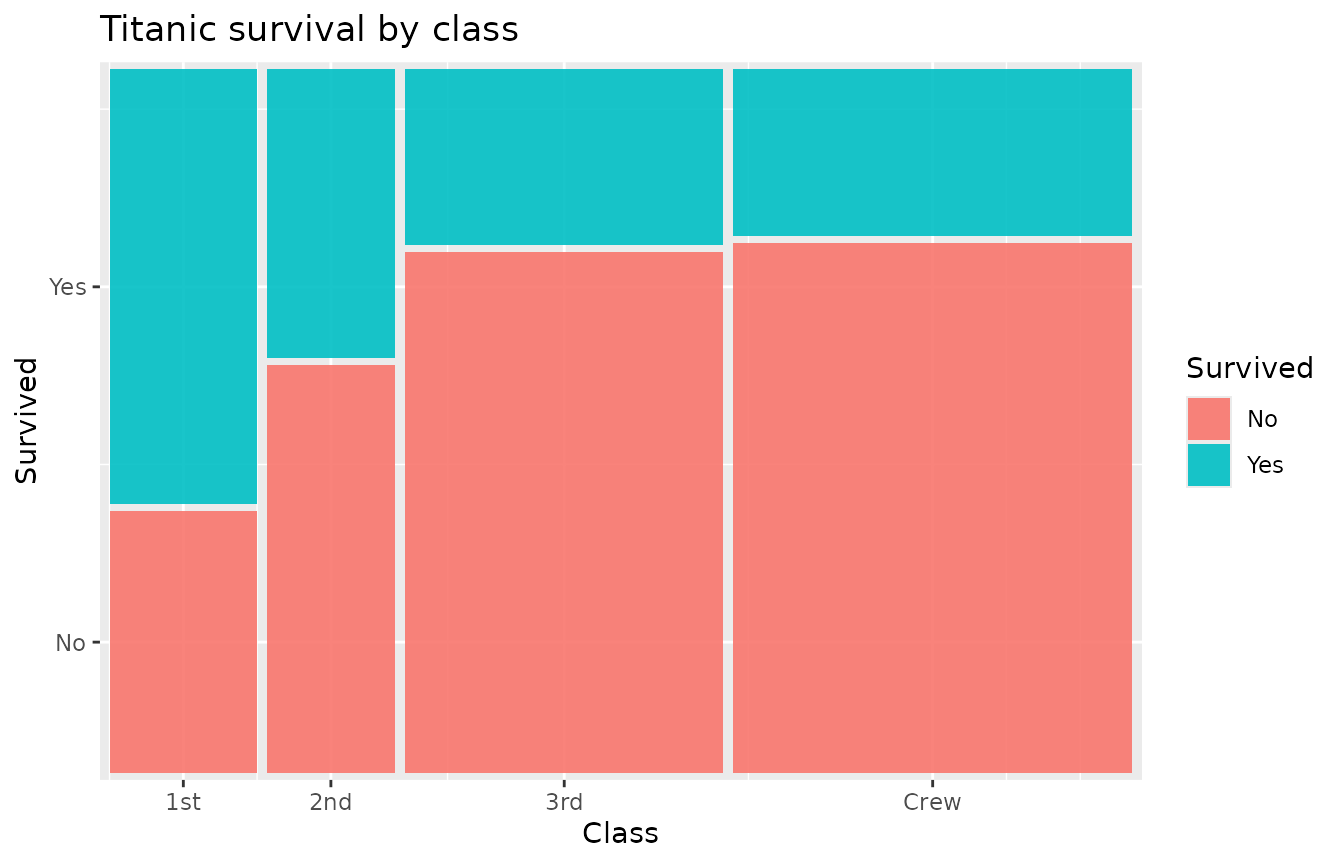
Two components are at work:
-
geom_marimekko()computes tile positions from your data. Theformuladefines the variables (columns and segments),filldefines the segment colours, andweightprovides the counts. Axis labels are automatically added. - Standard ggplot2 functions (
labs(),theme(), etc.) work as usual.
Aesthetics
geom_marimekko() understands these aesthetics and
parameters:
| Parameter / Aesthetic | Required | Description |
|---|---|---|
formula |
yes | Formula specifying variables, e.g. ~ X \| Y
|
fill |
no | Categorical variable for segment colours (defaults to last formula variable) |
weight |
no | Numeric weight/count (default 1) |
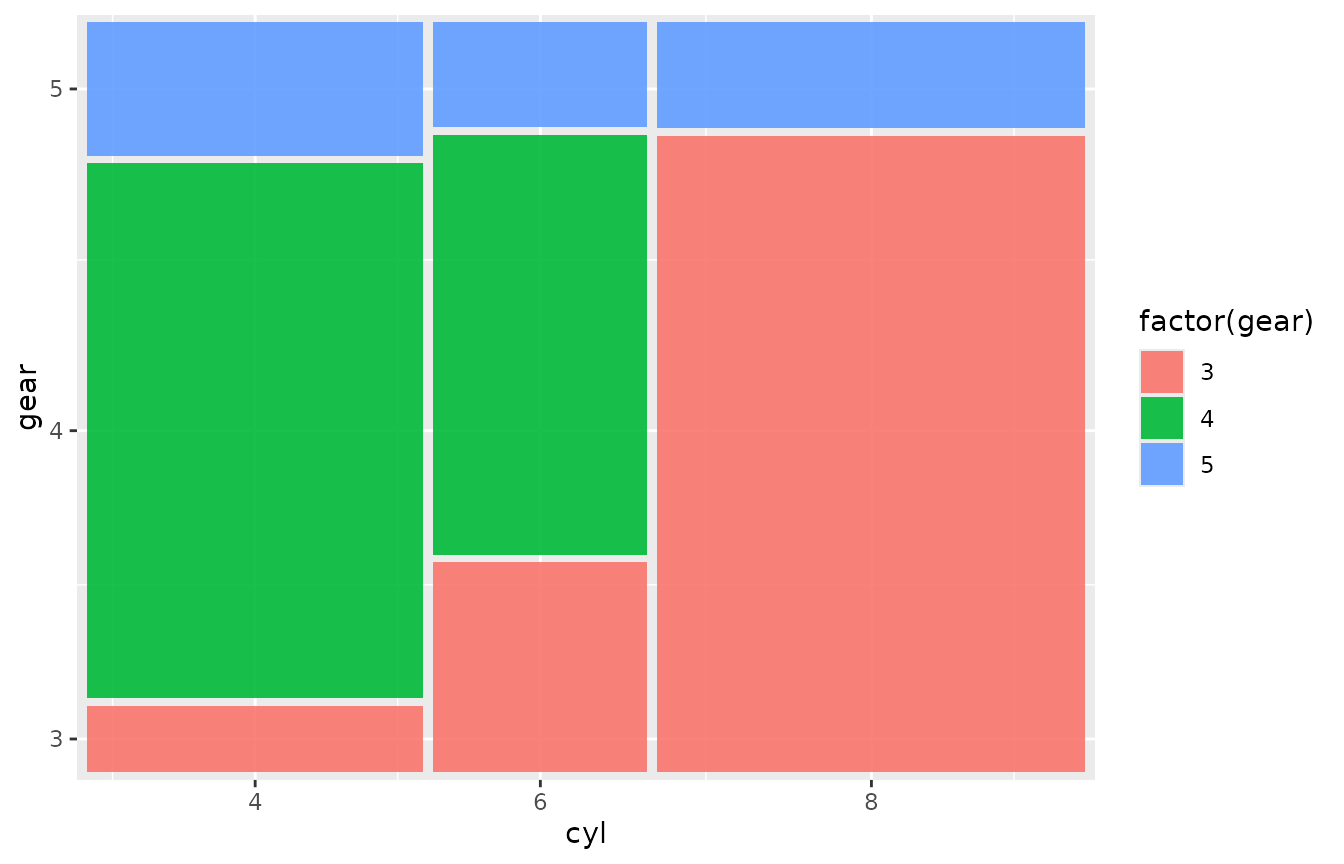
If your data already has one row per observation (no aggregation
needed), omit weight:
ggplot(mtcars) +
  geom_marimekko(aes(fill = factor(gear)),
    formula = ~ cyl | gear
  )
Gap control
The gap parameter controls spacing between tiles as a
fraction of the plot area. Default is 0.01.
ggplot(titanic) +
  geom_marimekko(aes(fill = Survived, weight = Freq),
    formula = ~ Class | Survived, gap = 0.03
  ) +
  labs(title = "Wider gaps (gap = 0.03)")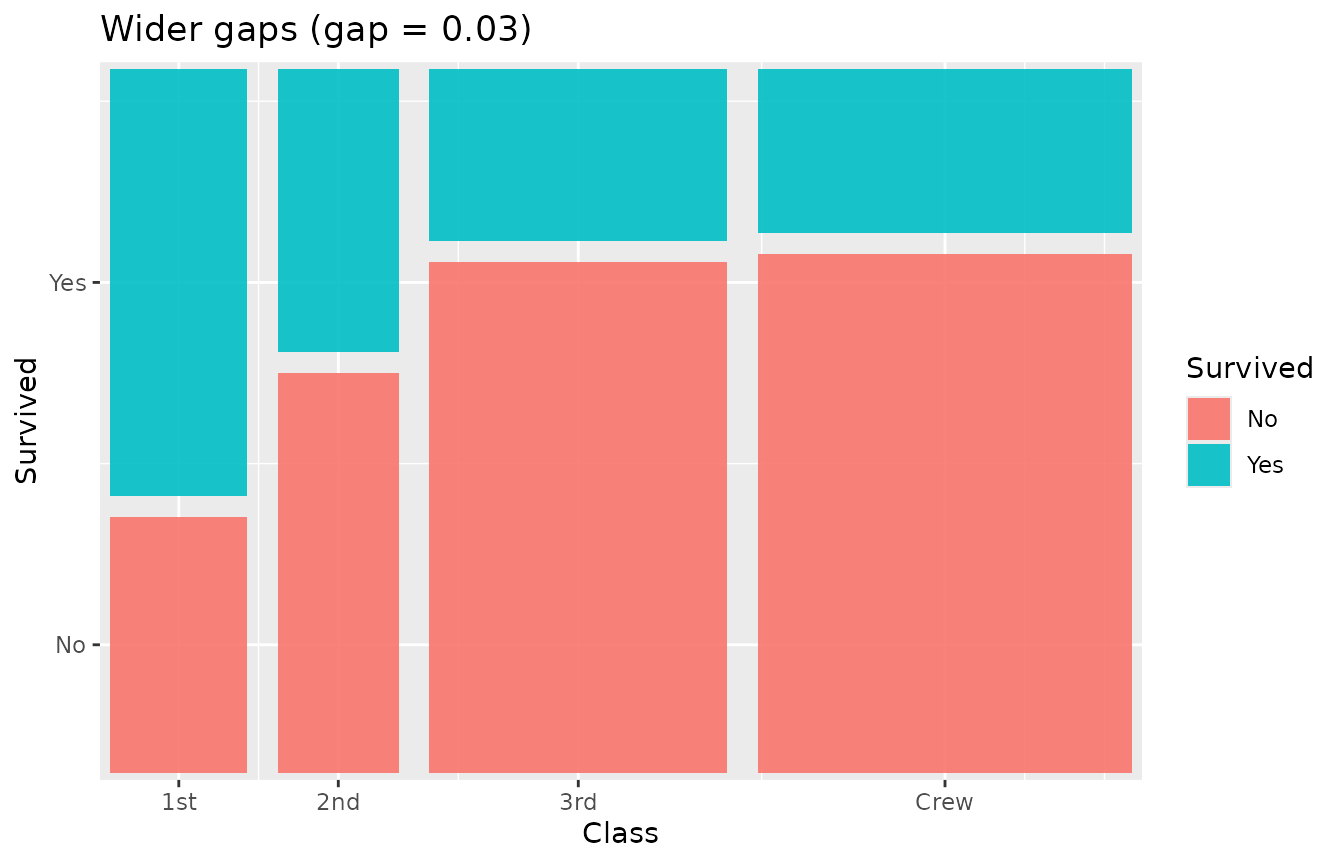
Set gap = 0 for a seamless mosaic:
ggplot(titanic) +
  geom_marimekko(aes(fill = Survived, weight = Freq),
    formula = ~ Class | Survived, gap = 0
  ) +
  labs(title = "No gaps")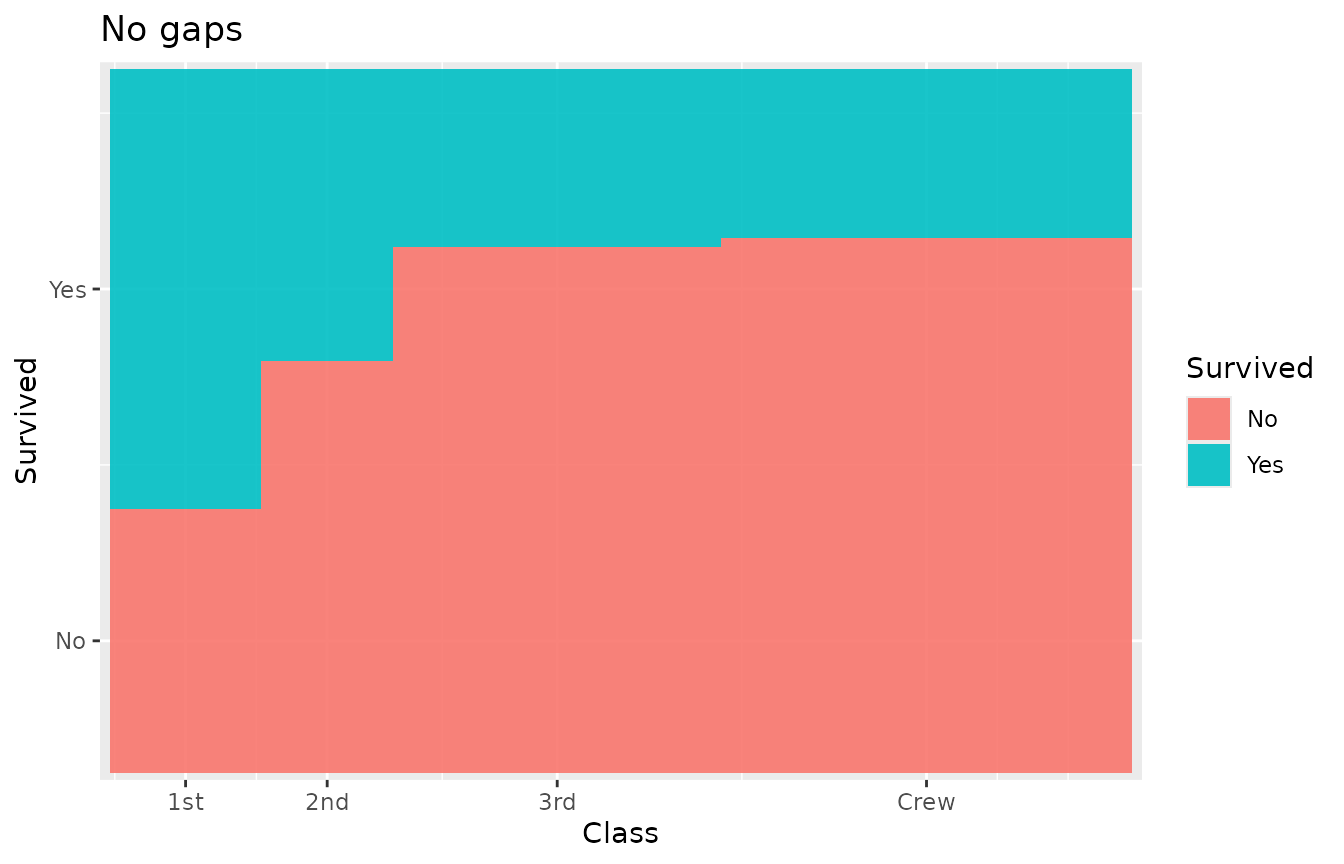
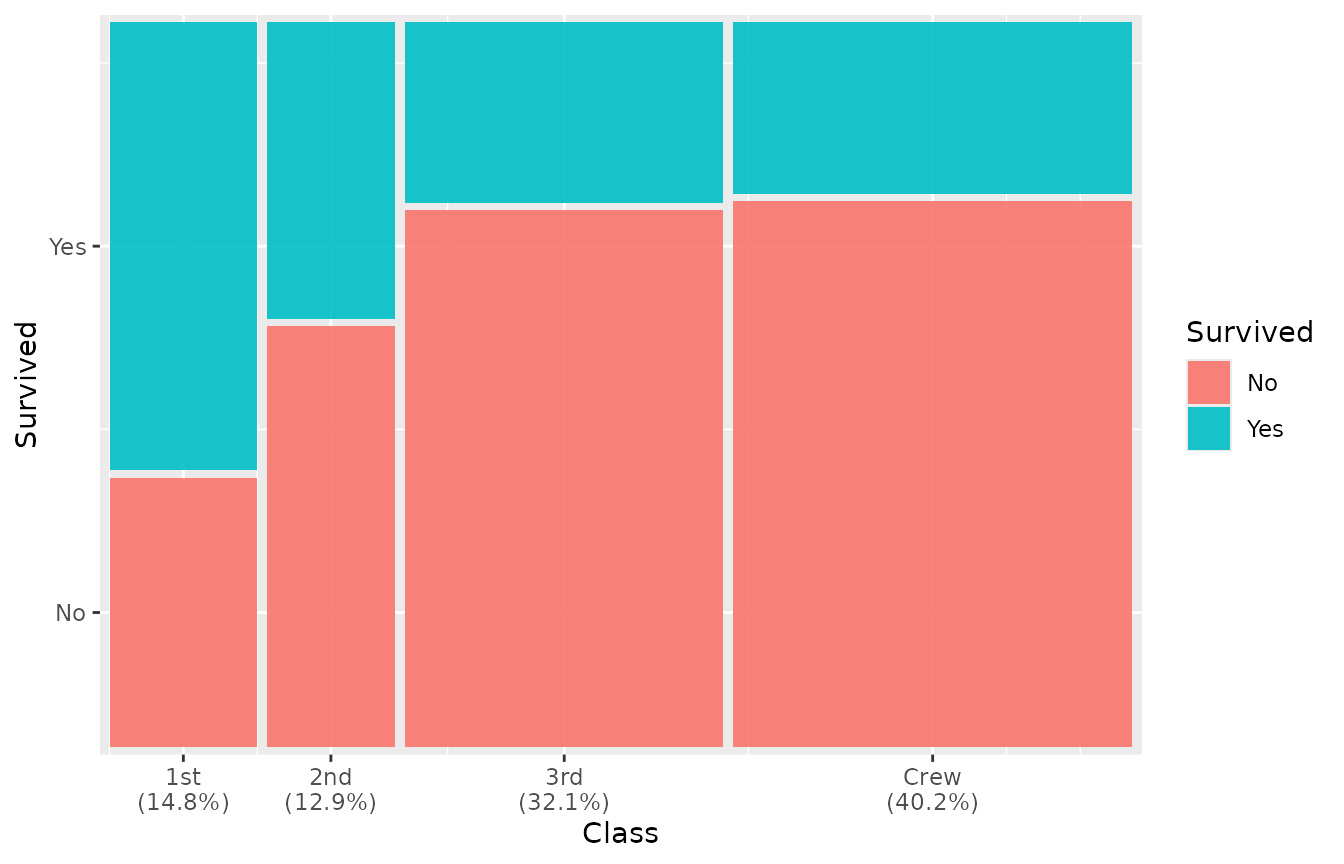
Marginal percentages
geom_marimekko() can append marginal percentages to the
x-axis labels via the show_percentages parameter:
ggplot(titanic) +
  geom_marimekko(aes(fill = Survived, weight = Freq),
    formula = ~ Class | Survived,
    show_percentages = TRUE
  )
Adding text labels
Use geom_marimekko_text() (or
geom_marimekko_label() for a boxed version) to place labels
at tile centers. Tile positions are read automatically from the
preceding geom_marimekko() layer — only the
label aesthetic is needed. Reference computed variables via
after_stat():
-
weight– the aggregated count for the tile -
cond_prop/.proportion– the conditional proportion within the parent -
.residuals– Pearson residual - Original variable columns (e.g.
Class,Survived)
ggplot(titanic) +
  geom_marimekko(aes(fill = Survived, weight = Freq), formula = ~ Class | Survived) +
  geom_marimekko_text(aes(label = after_stat(weight)), colour = "white") +
  labs(title = "Counts inside tiles")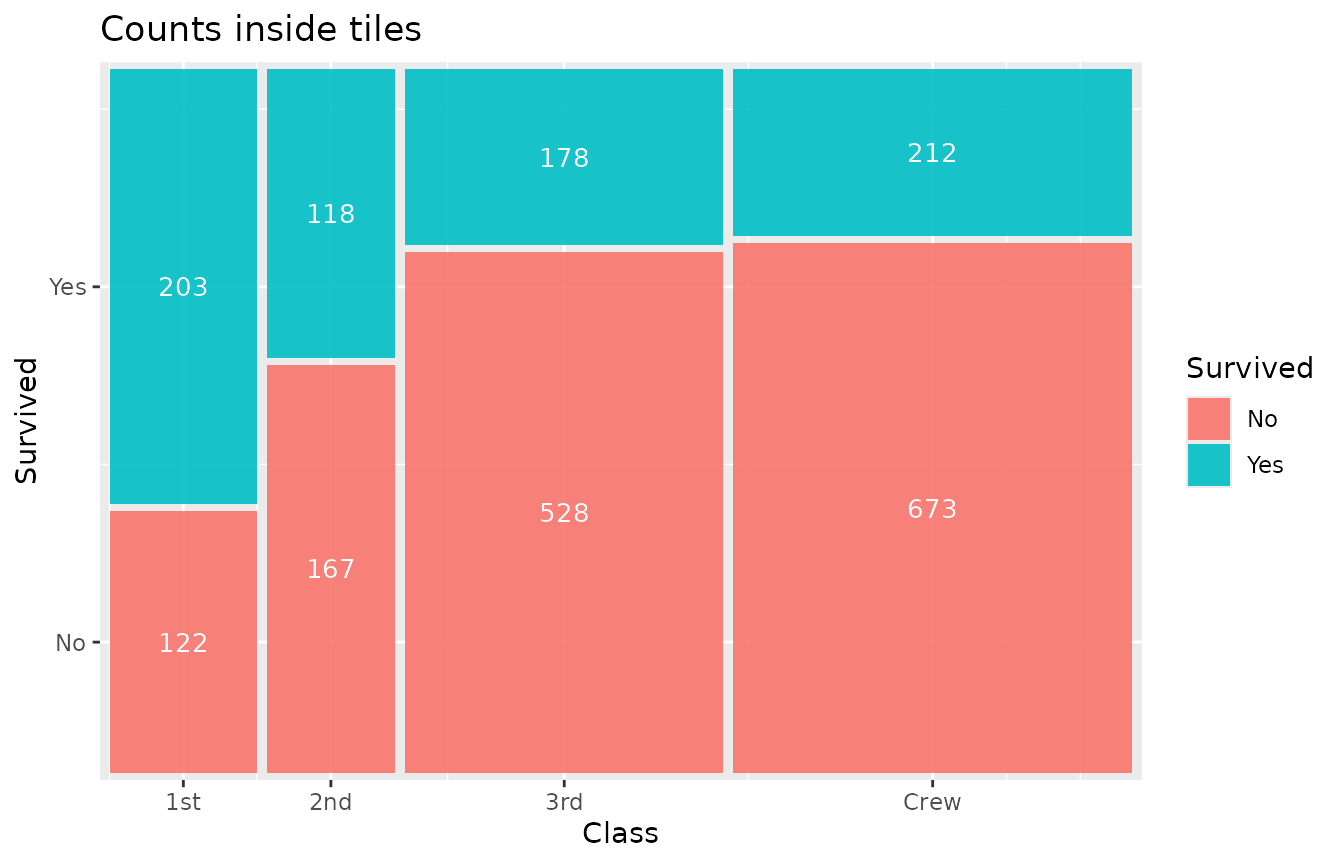
Percentage labels:
ggplot(titanic) +
  geom_marimekko(aes(fill = Survived, weight = Freq), formula = ~ Class | Survived) +
  geom_marimekko_text(aes(
    label = after_stat(paste0(round(cond_prop * 100), "%"))
  ), colour = "white", size = 3)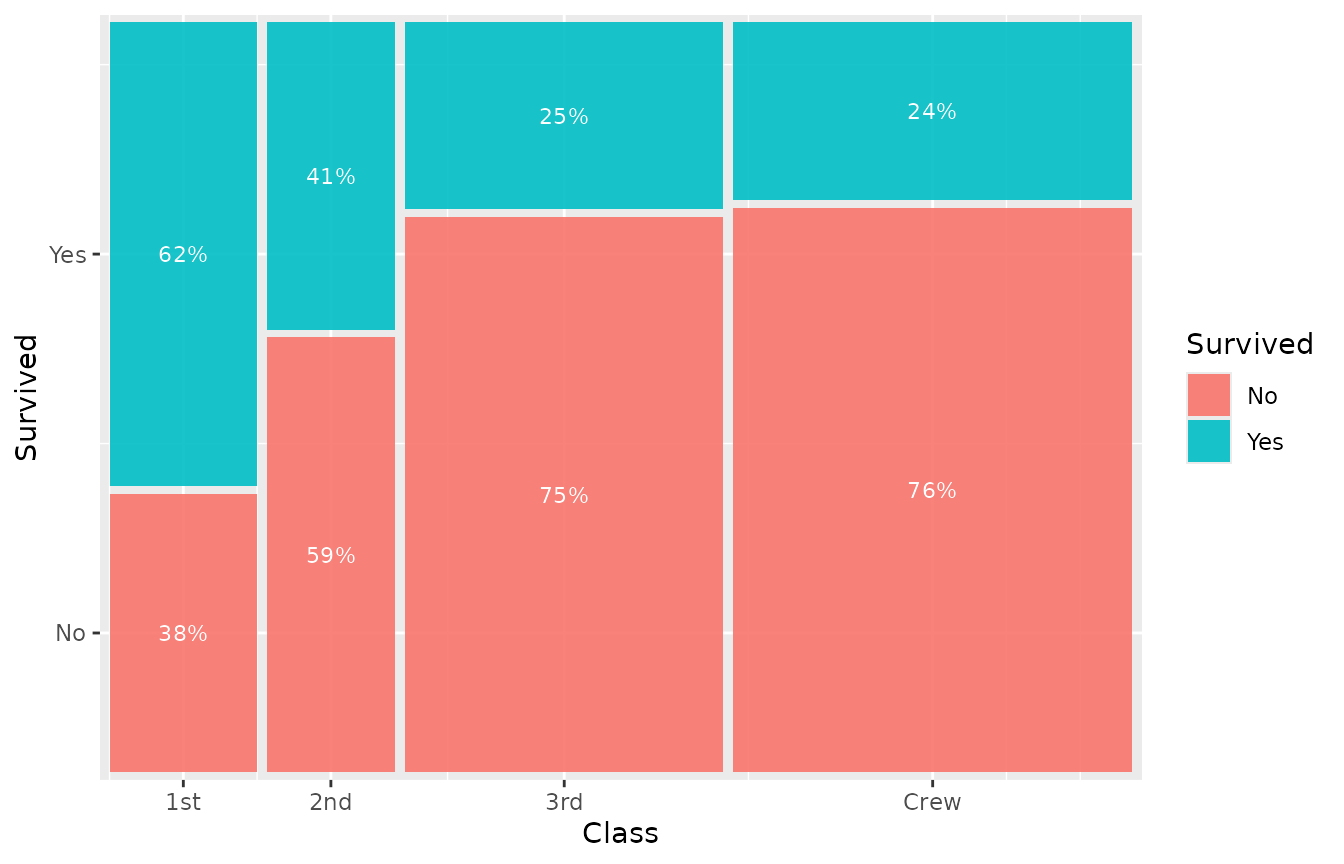
Theming
theme_marimekko() provides a clean, minimal theme that
removes distracting x-axis gridlines:
ggplot(titanic) +
  geom_marimekko(aes(fill = Survived, weight = Freq), formula = ~ Class | Survived) +
  theme_marimekko() +
  labs(title = "With theme_marimekko()")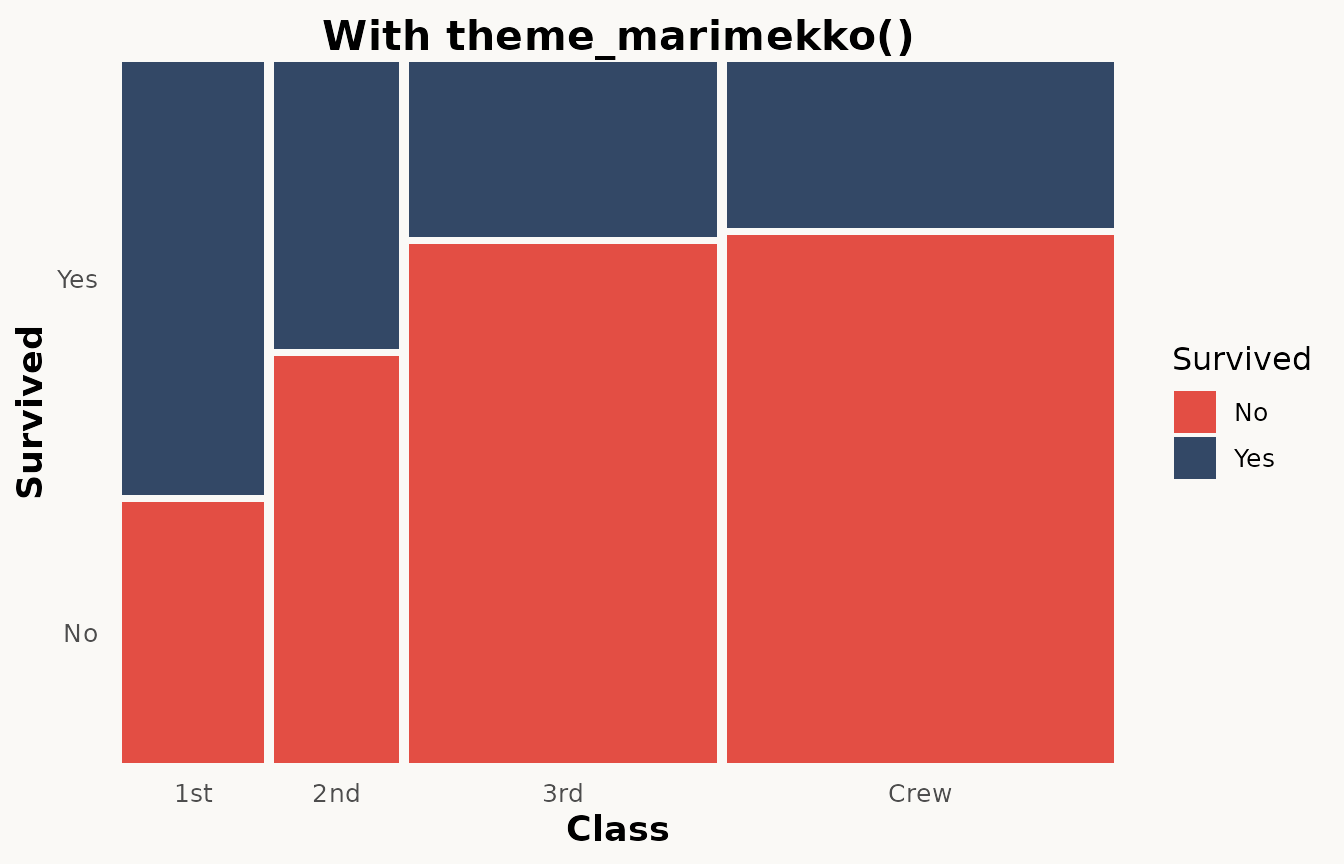
Since it builds on theme_minimal(), you can override any
element:
ggplot(titanic) +
  geom_marimekko(aes(fill = Survived, weight = Freq), formula = ~ Class | Survived) +
  theme_marimekko() +
  theme(legend.position = "bottom")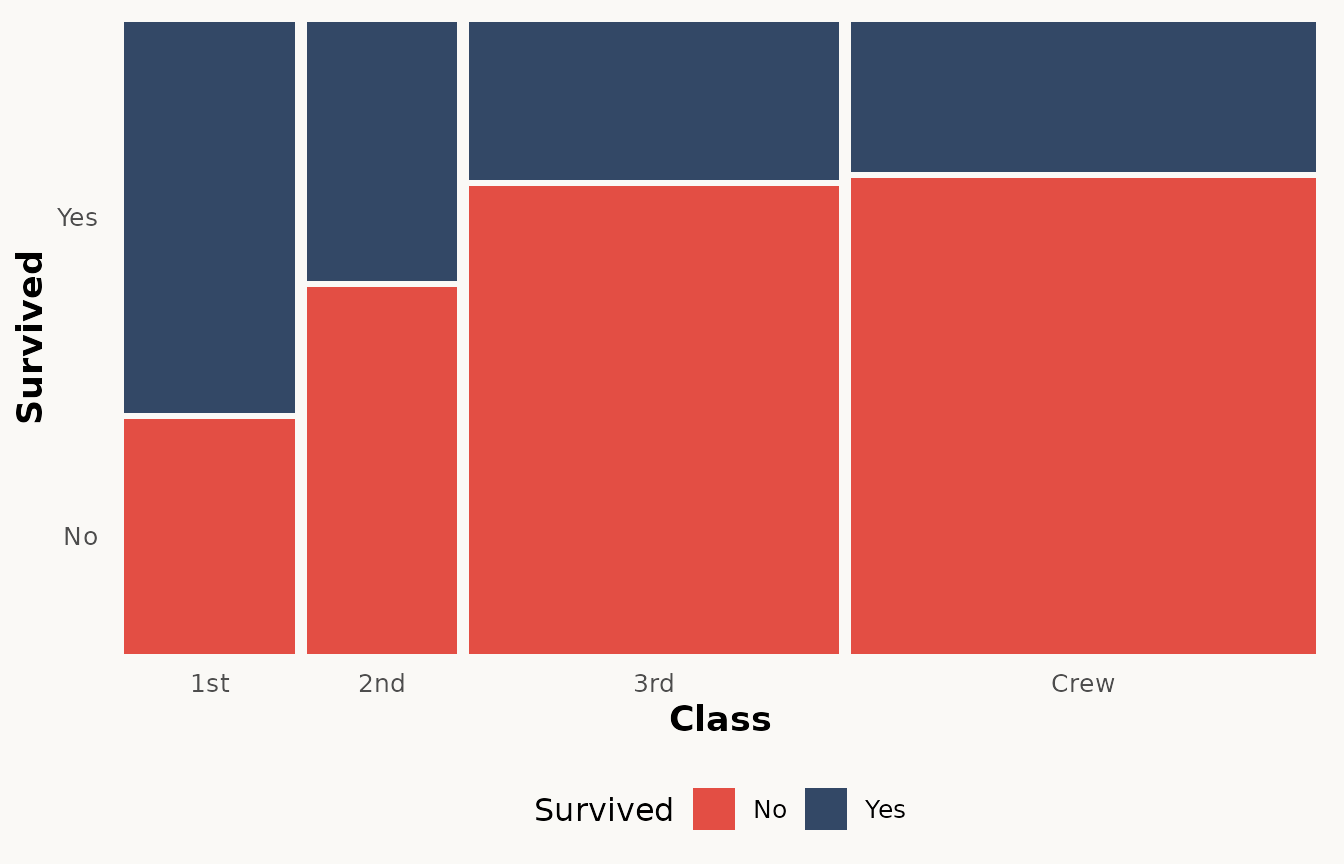
Faceting
geom_marimekko() supports ggplot2 faceting. Each panel
gets its own independently proportioned mosaic:
ggplot(as.data.frame(Titanic)) +
  geom_marimekko(aes(fill = Survived, weight = Freq), formula = ~ Class | Survived) +
  facet_wrap(~Sex) +
  labs(title = "Survival by class, faceted by sex")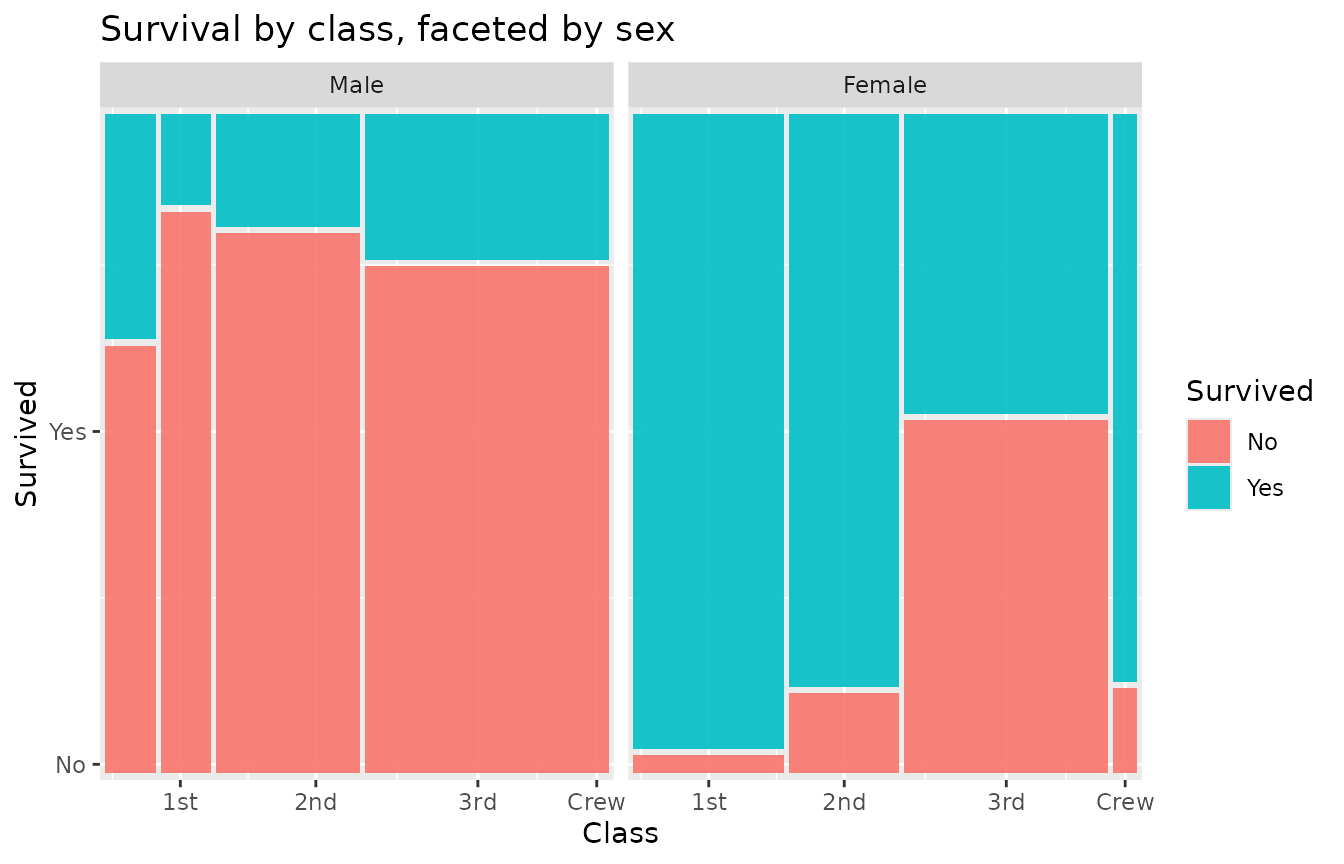
Next steps
See vignette("advanced-features") for spine plots,
Pearson residuals, three-variable mosaics, and programmatic data
extraction with fortify_marimekko().